Institutional-Grade Market Data Is Now Built Into Every Sorin Analysis
Starting today, every analysis Sorin runs draws on institutional-grade market data from Nansen and Coinglass. Smart money flows, whale activity, derivatives positioning, liquidation maps, and live order flow are now built in, the same data professional trading desks rely on.
Price is a lagging signal. The accumulation, the leverage, and the resting orders that drive a move show up in the data well before they reach a candle. Sorin now reads that data directly, so its analysis reflects how a move is being positioned while it is still forming.
What Sorin Can Now See
Ask Sorin about any supported token and it can now read:
Where smart money is flowing: netflow, holdings, and live DEX trades from proven wallets
Who is actually accumulating: holder flows, buyers versus sellers, transfers, and PnL leaders
How leverage is positioned: open interest, funding, crowding, and squeeze risk
Where liquidations cluster: heatmaps, max pain, and forced-flow levels
How order flow is stacking up: CVD, exchange netflow, large orders, and whale alerts
What the biggest traders hold: exposure, large positions, and PnL leaderboards
The exact levels to trade around: raw spot candle data for precise entries, invalidations, and targets
Track Smart Money and Whale Activity Before Price Moves
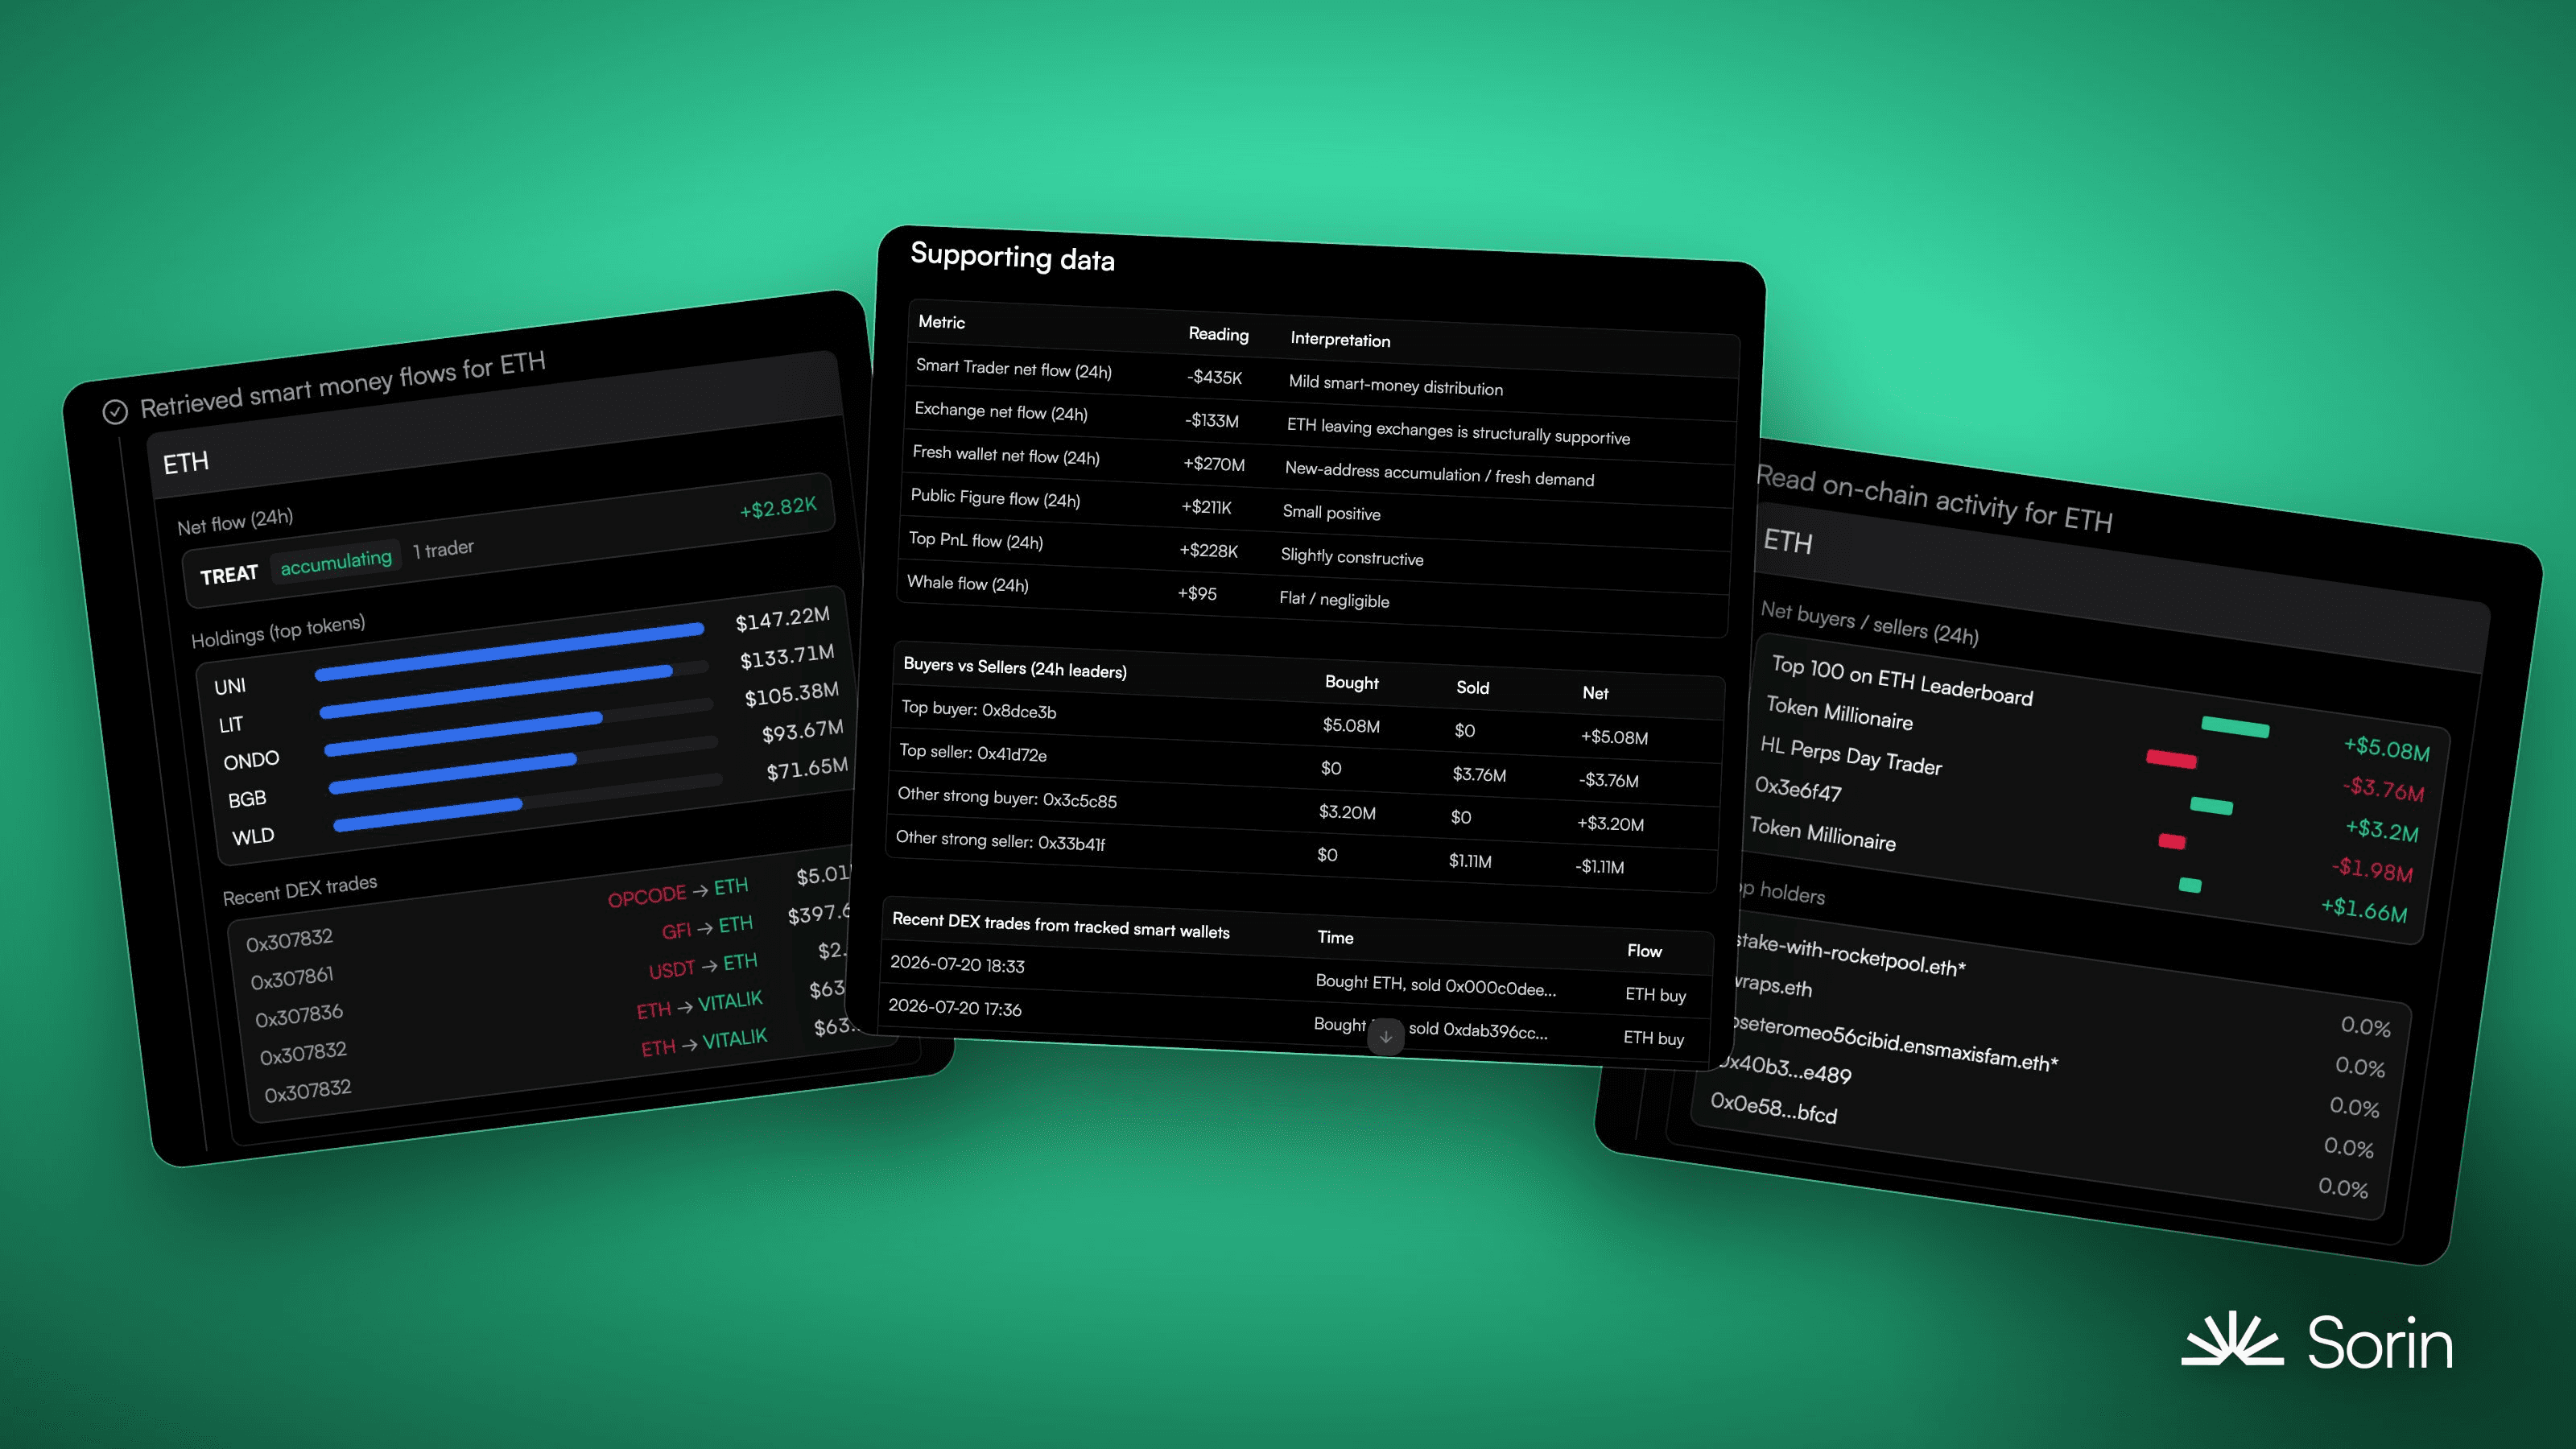
Smart money moves ahead of the chart. Sorin can now identify which proven wallets are accumulating or distributing a token, how the holder base is shifting beneath the price, and the DEX trades those wallets are making in real time. It reads netflow, current holdings, whale activity, and the wallets leading on realized PnL, so you can see who is actually behind a move instead of inferring it from price.
See Derivatives Positioning and Liquidation Risk Behind Every Move

Price alone does not show the leverage behind a move. Sorin now reads open interest, funding rates, and the long/short balance to show where leverage is concentrated and how much squeeze risk is built in. Its liquidation map shows where forced selling or buying is likely to trigger and the levels a move tends to gravitate toward. That lets Sorin separate a move backed by real spot demand from one sitting close to an unwind.
Read Real-Time Order Flow Before It Hits the Chart
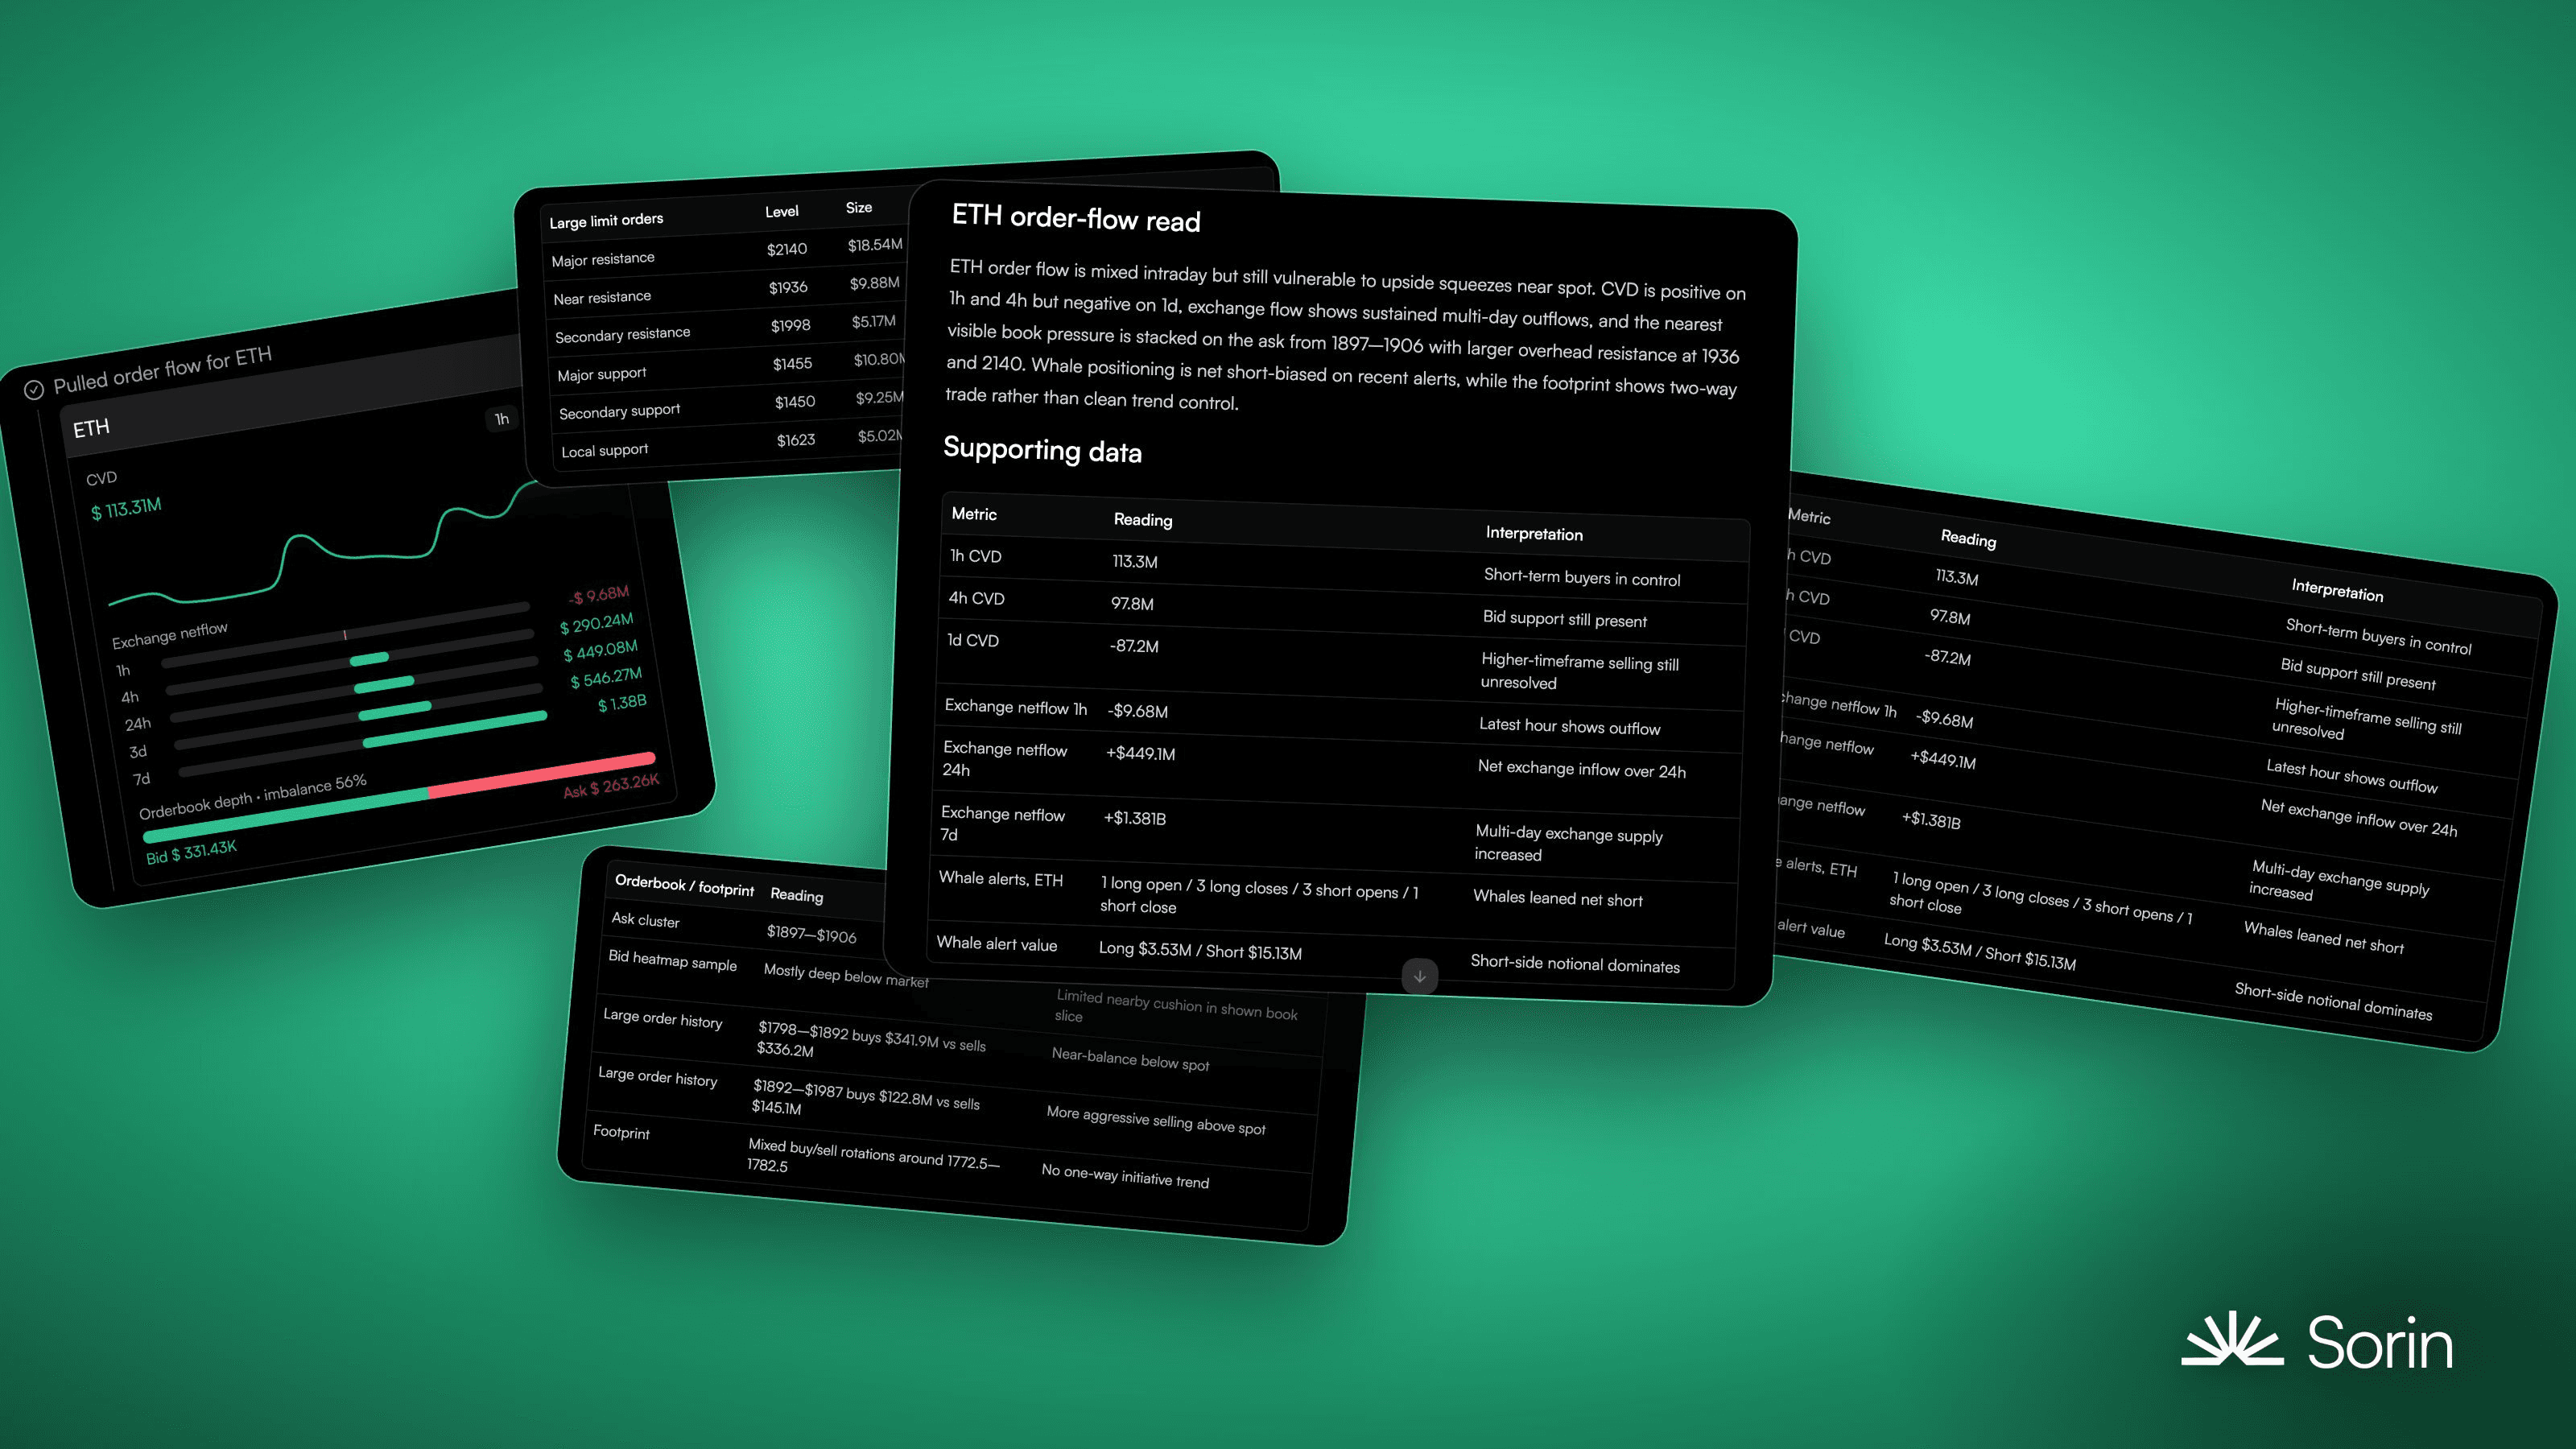
Order flow leads price. Sorin now reads cumulative volume delta, or CVD, to show whether buyers or sellers are leaning in across timeframes. It tracks exchange netflow, the movement of coins toward or away from selling pressure, and surfaces the large resting orders and whale prints that shape what happens next.
Trade From Exact, Real-Time Price Levels
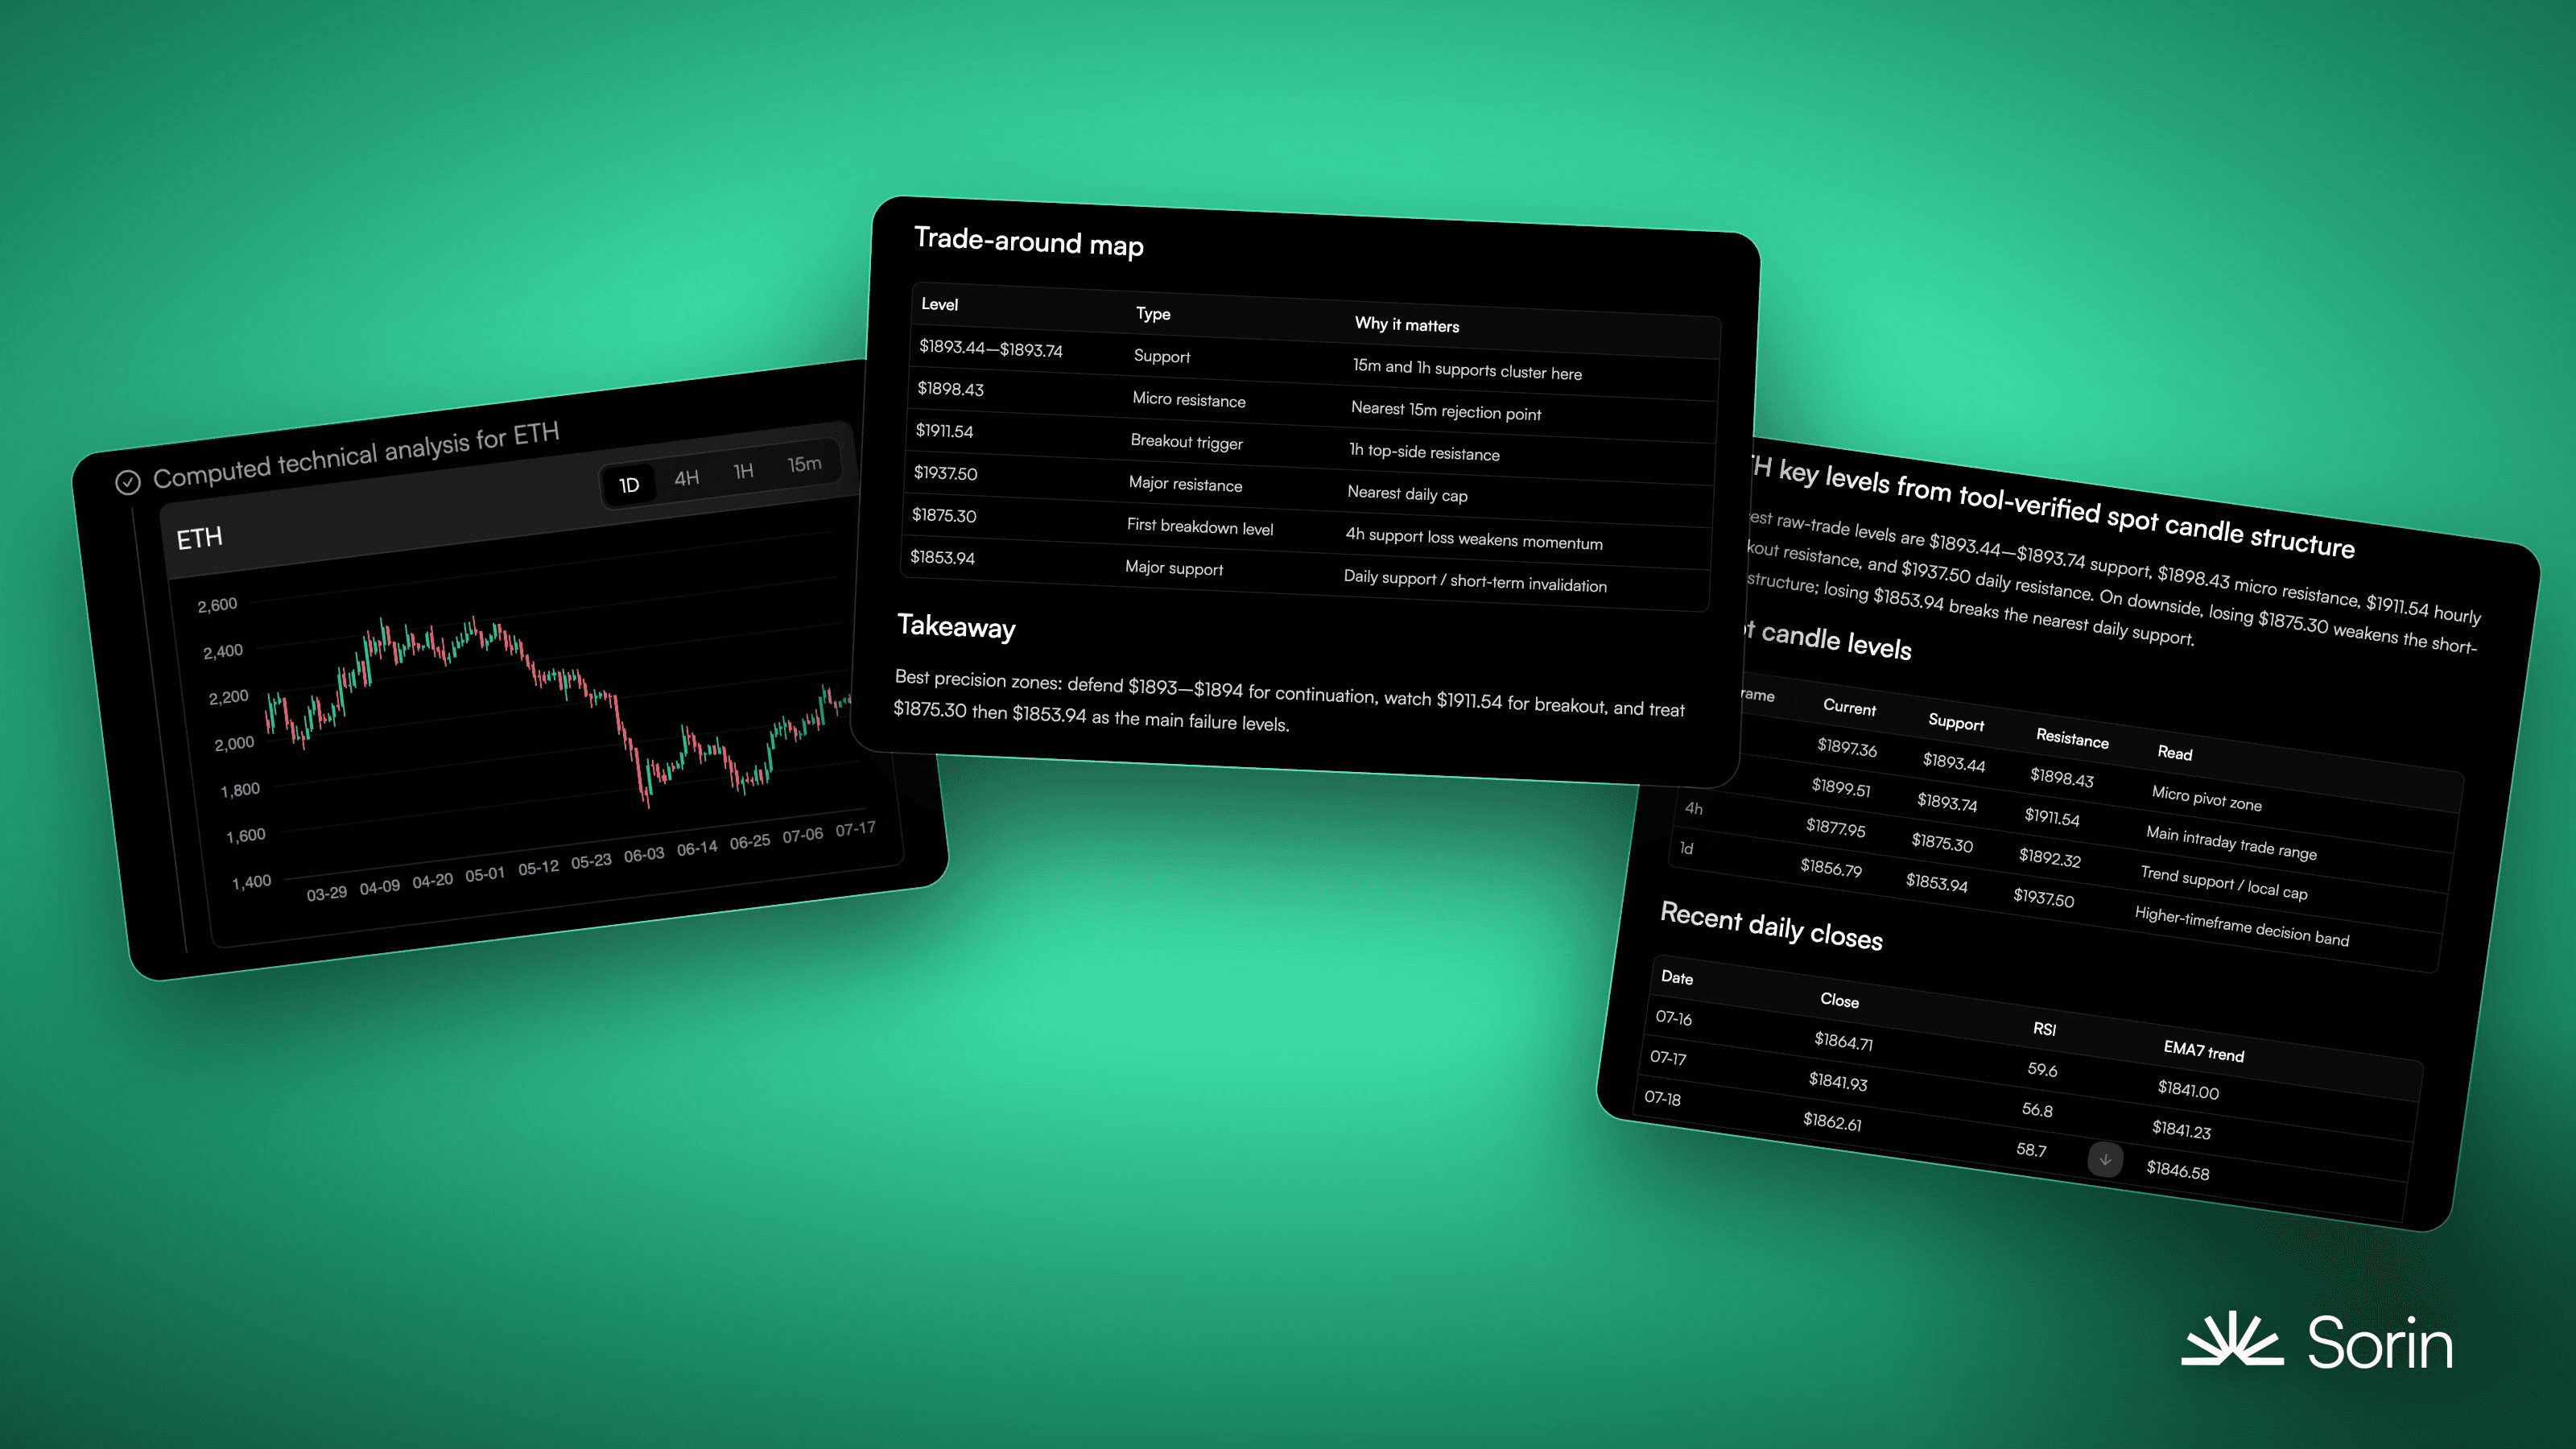
A trade plan is only as reliable as the prices behind it. Sorin works from raw, real-time spot price data, so the entries, invalidations, and targets it produces are drawn from where price has actually traded rather than estimated from a chart or rounded to a clean number.
Get Started Today
There is nothing to set up. Ask Sorin about any supported token and it pulls this data into its analysis automatically. Available now at heysorin.ai.
Follow Sorin on X for market breakdowns and product updates.


